
Let the graphs do the talking — Historical Utilization in Clarity
In our last blog, we introduced ERP Suites Clarity's Application Management feature. Let's dig deeper now into historical data. Clarity not only provides average or maximum application server and JAS server statistics, but it can also pull data from yesterday, last week, or even the entire month. Clarity retains data for 45-60 days, so if you want to pull data from a custom date range, you absolutely can. You can toggle between Average and Max results in that date range too.
Why is this helpful? Let's say there is an issue with one of your enterprise servers. Maybe your jobs aren't processing as quickly, or you're wondering, "Why is my system so slow?" With Clarity, you can track the last seven days and see what the data tells you.
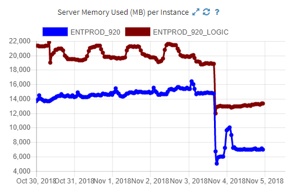
For example, this Server Memory Used per Instance graph shows us that server memory for two production application servers ran high for more than half a week. Moving into the weekend, when a full restart of the EnterpriseOne system occurred, memory dropped quite a bit for both applications servers.
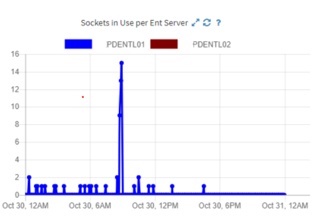
The Sockets in Use per Ent Server graph reveals that on October 30, 6 a.m.–noon, up to 16 server sockets were in use. We like to keep this number low, so this could indicate an issue. But if you weren't sure what these metrics suggested, you could click the "?" symbol to get a short description.
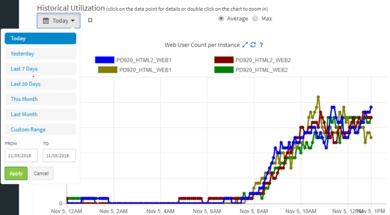
ERP Suites CNCs also like to track JAS servers and how they are processing. There are several graphs in Historical Utilization that help with this, including:
- Web User Count per Instance
- Java Heap Used
- Idle Time
- Open Applications per Instance
- Average Call Object Time per Instance
- Call Object Errors
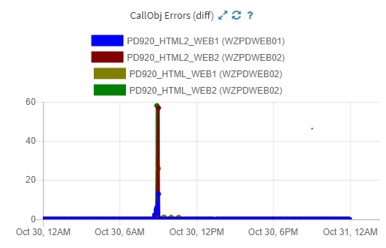
Examining Call Object Errors on that day, we find there were also a very high number of errors at that same time.
Historical Utilization data can help you quickly narrow down when an event occurred. Furthermore, it points you in the right direction to resolve the issue. Then, you can use Clarity's log parser to track down logs in that exact timeframe. If you don't have an alert set up for the issue, add a subscription. The next time it occurs, Clarity will give you a heads up.
Check out our next blog to explore how to use Clarity to strengthen JDE security.
New to ERP Suites Clarity and want to learn more? Contact us. We’re happy to show you around.
Topics: