ERP Suites Clarity: application management feature
Application monitoring tools are bursting with data. But making sense of that data is daunting if you don’t know where to dig in. If you’re an ERP Suites Clarity user, today’s blog can help. Read on to learn how you can spot load balancer issues and more.
When a system goes down, you need to find the culprit and get the business back up ASAP. Clarity scans all the usual suspects saving you precious time. The Most Recent Utilization section under Application Management provides high-level intelligence on your enterprise application at a glance.
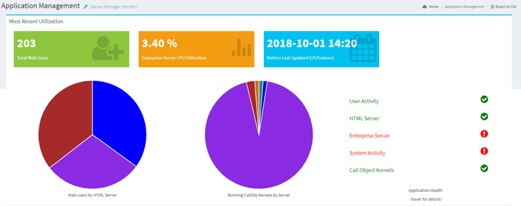
Like a detective, you first need to gather the facts. Look at the blue box to see when metrics were last updated. The timestamp reassures you that the data is current. Check the Enterprise Server CPU Utilization box to verify your server’s health—the lower the percentage, the better. Then, review the green box to see the total number of web users logged in.
Next, survey the pie charts for hidden clues. Hover over the Web Users by HTML Server sections to reveal a breakdown of the total users. These numbers might point to load balancer issues. Is the server distributing users properly? Did you forget to add one of the web servers back into the load balancer after weekend maintenance? If you don’t see any users logged in, there could be a problem with one of your web servers.
The Running Call Object Kernels by Server chart informs on how many call object kernels are running. Based on this number, you can deduce which is the logic server among other enterprise servers. If your logic server is running below normal capacity, you should investigate your system.
Moving on to Application Health parameters, watch for red exclamation point alerts. They help you quickly narrow down the source of an issue. Like the pie charts, you can hover over each key parameter to uncover detailed information:
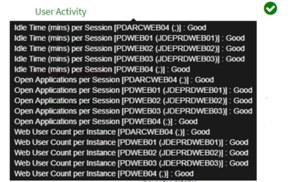
- User Activity — Idle Time, Open Applications per Session, and Web User Count per instance
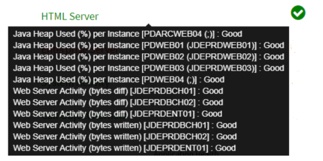
- HTML Server — Percentage of Java Heap Used and Web Server Activity (bytes written) per each web server
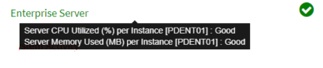
- Enterprise Server — Server CPU Utilized and Server Memory Used (If your application has multiple enterprise servers, metrics for each is displayed here.)
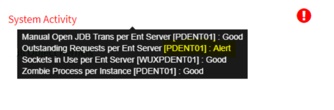
- System Activity — Manual Open JDB Transactions, Outstanding Requests, Sockets in Use, and Zombie Process per Instance
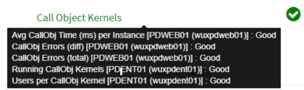
- Call Object Kernels — Average Call Object Kernel Time per Instance, Number of Running Call Object Kernels, Users per Call Object Kernels, and any Call Object Kernel errors (If any of these metrics are off, this parameter will tell you which server to explore.)
Think of Clarity as your investigative partner. Use the Application Management feature to solve system issues quickly and keep your business in business. Next, we'll uncover the secrets of Historical Utilization data to pinpoint when an event occurred and answer the popular question, "Why is my system so slow?"
New to ERP Suites Clarity and want to learn more? Contact us. We’re happy to show you around.
Topics:


.png?width=650&height=325&name=Blog%20Images%202_1%20(4).png)
.png?width=650&height=325&name=Blog%20Images%202_1%20(5).png)
.png?width=650&height=325&name=Blog%20Images%202_1%20(3).png)
.png?width=650&height=325&name=Blog%20Images%202_1%20(2).png)
.png?width=650&height=325&name=Blog%20Images%202_1%20(1).png)
.png?width=960&height=540&name=Blog%20Images%20(96).png)

.png?width=960&height=540&name=Blog%20Images%20(90).png)
.png?width=960&height=540&name=Blog%20Images%20(88).png)
.png?width=960&height=540&name=Blog%20Images%20(87).png)
.png?width=960&height=540&name=Blog%20Images%20(86).png)
.png?width=960&height=540&name=Blog%20Images%20(85).png)
.png?width=960&height=540&name=Blog%20Images%20(83).png)